CANDAC data at PEARL, Eureka Weather Station (80N,86W), from several ground instruments.
Remote sensing profilers
Candac Radar & Lidar charts at Eureka, and derivative parameters.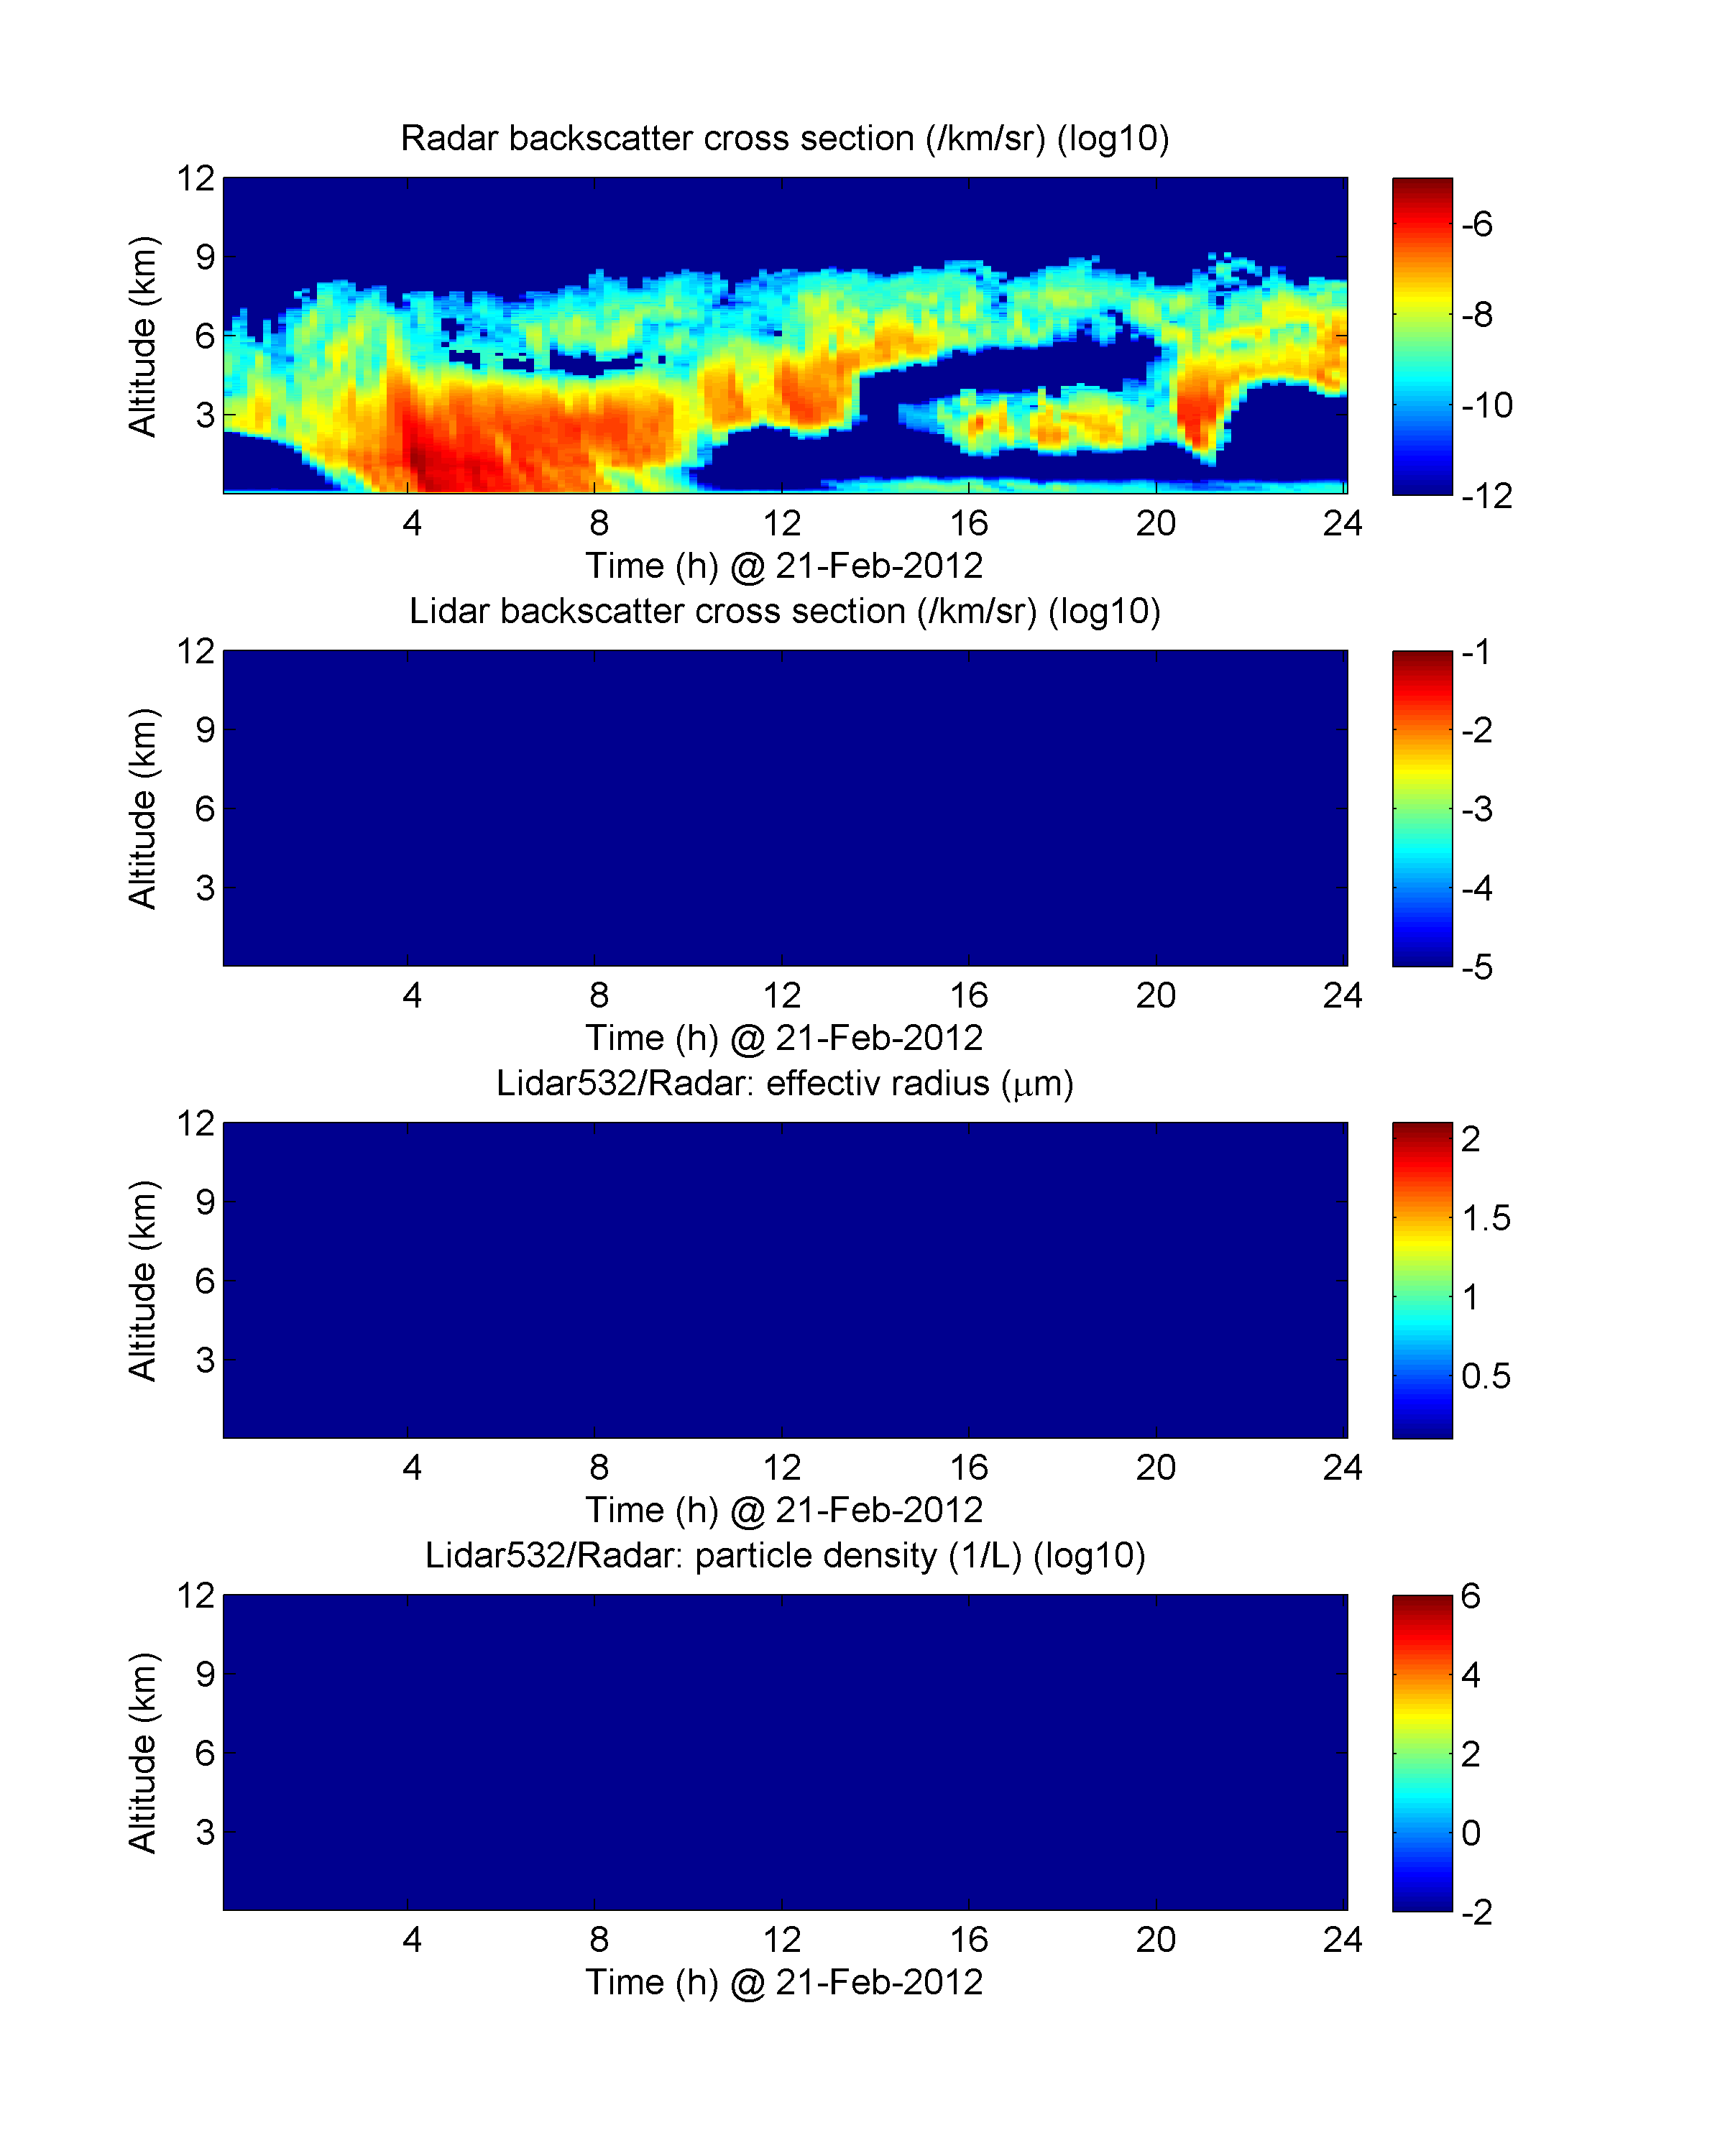
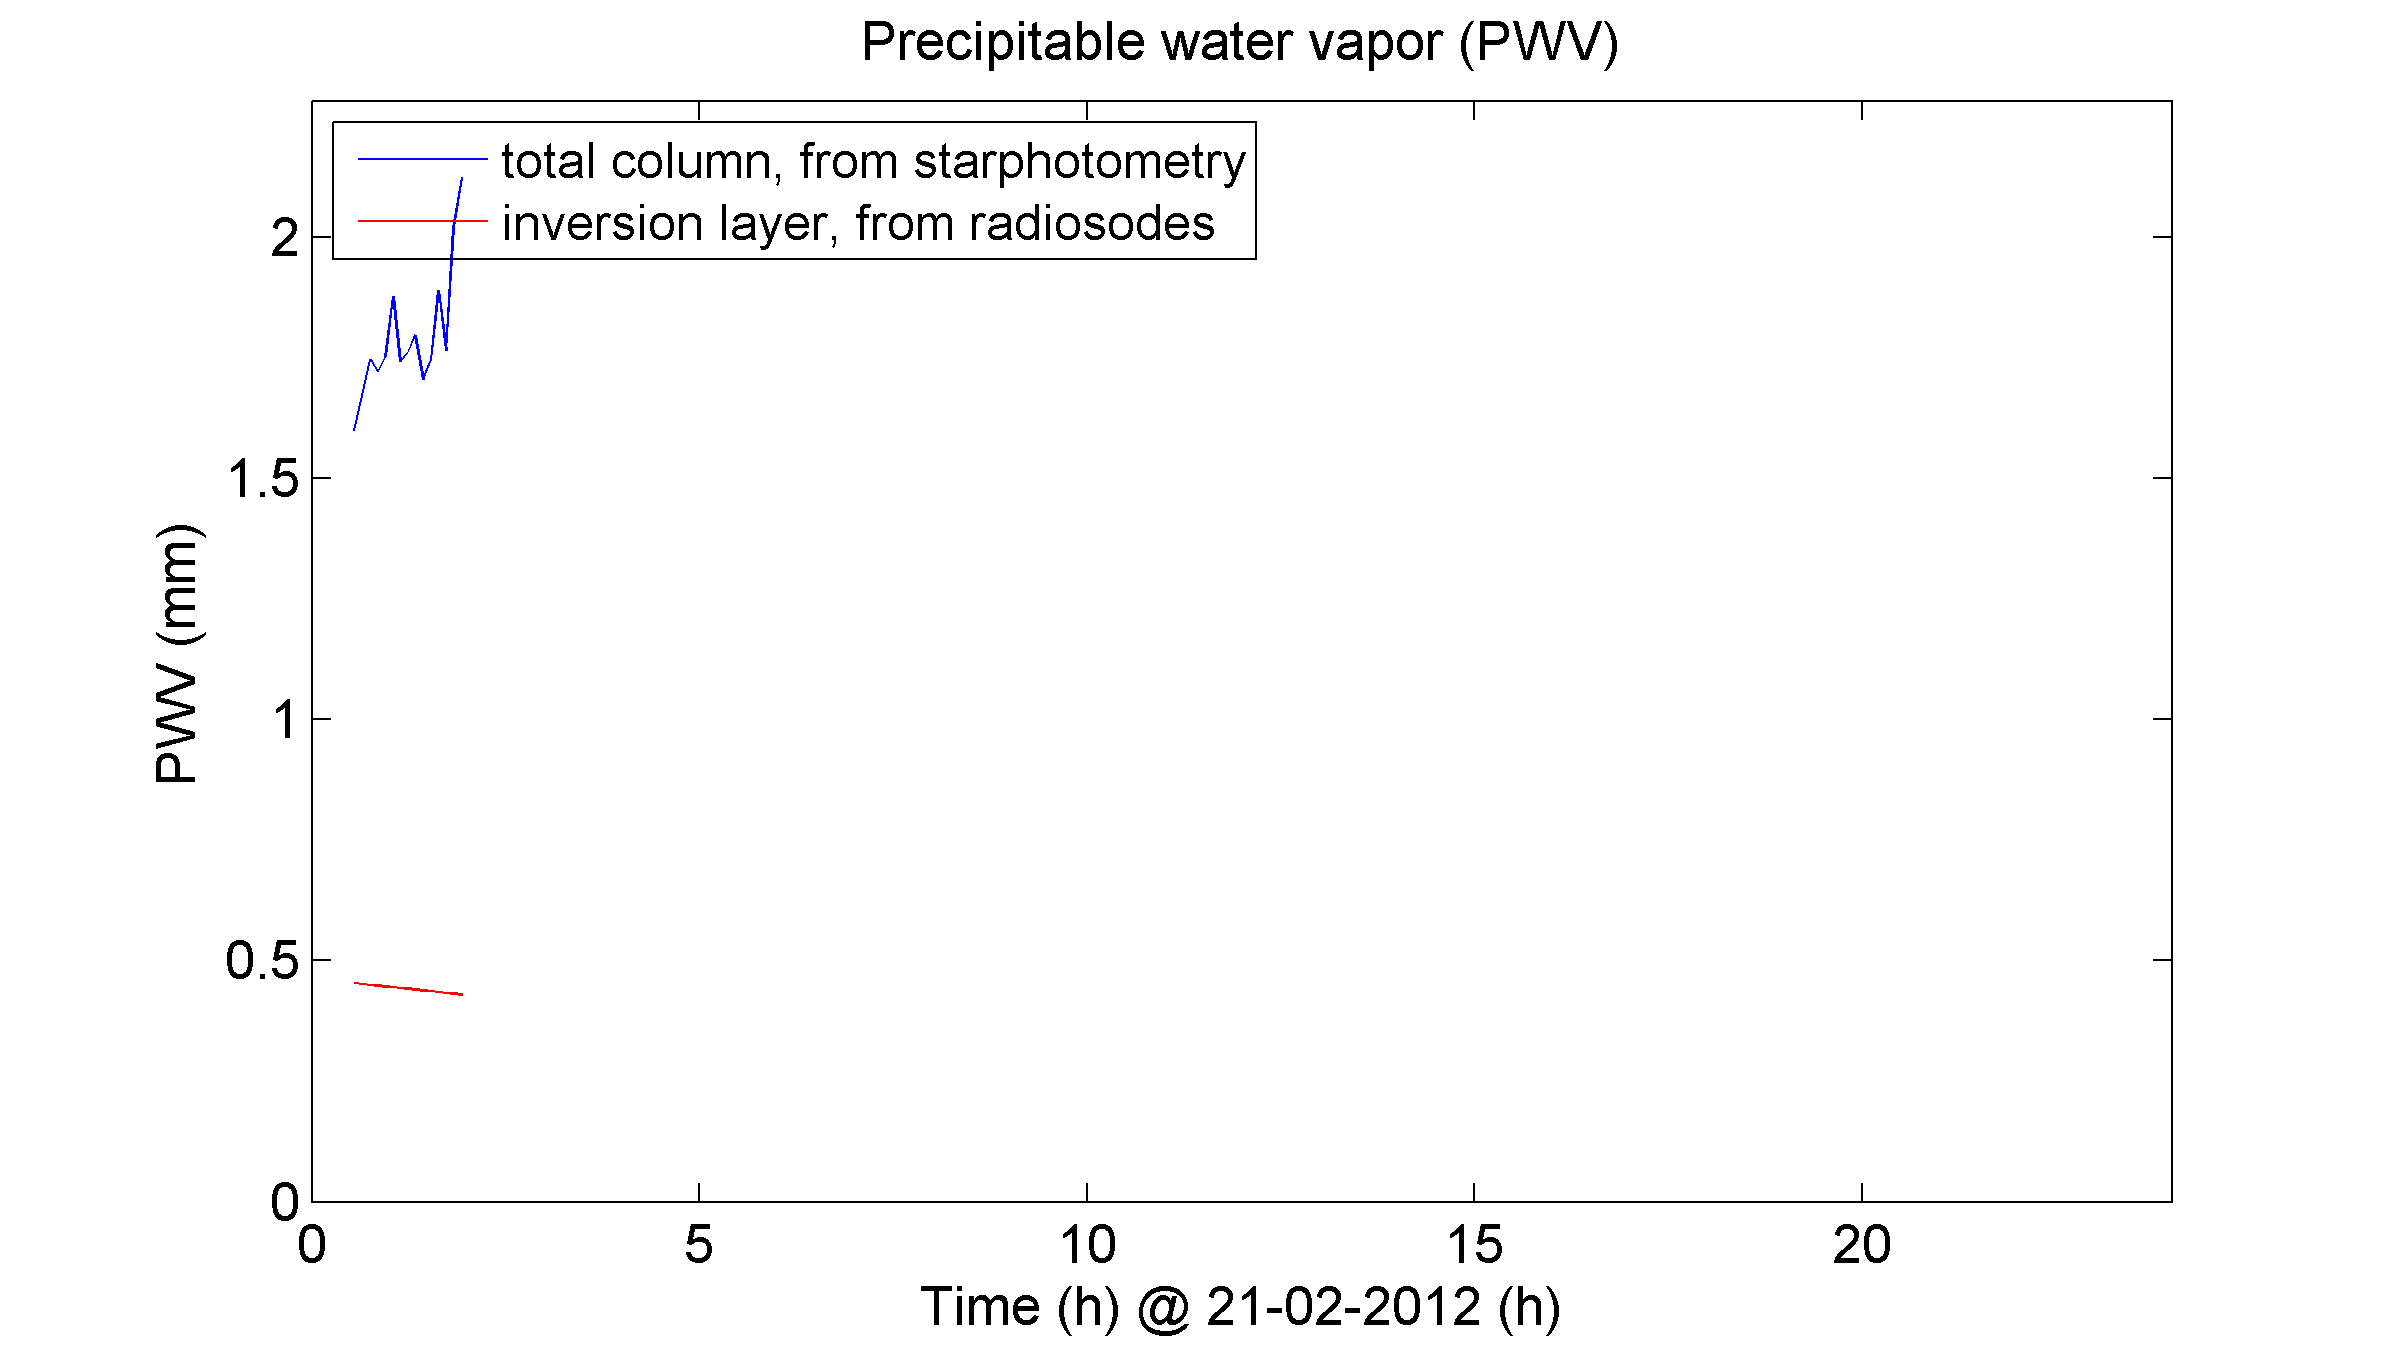
Star-photometer
Aerosols modes optical depth.

Forcing
Visible and infrared forcing as measured by fluxtower near the Eureka airport.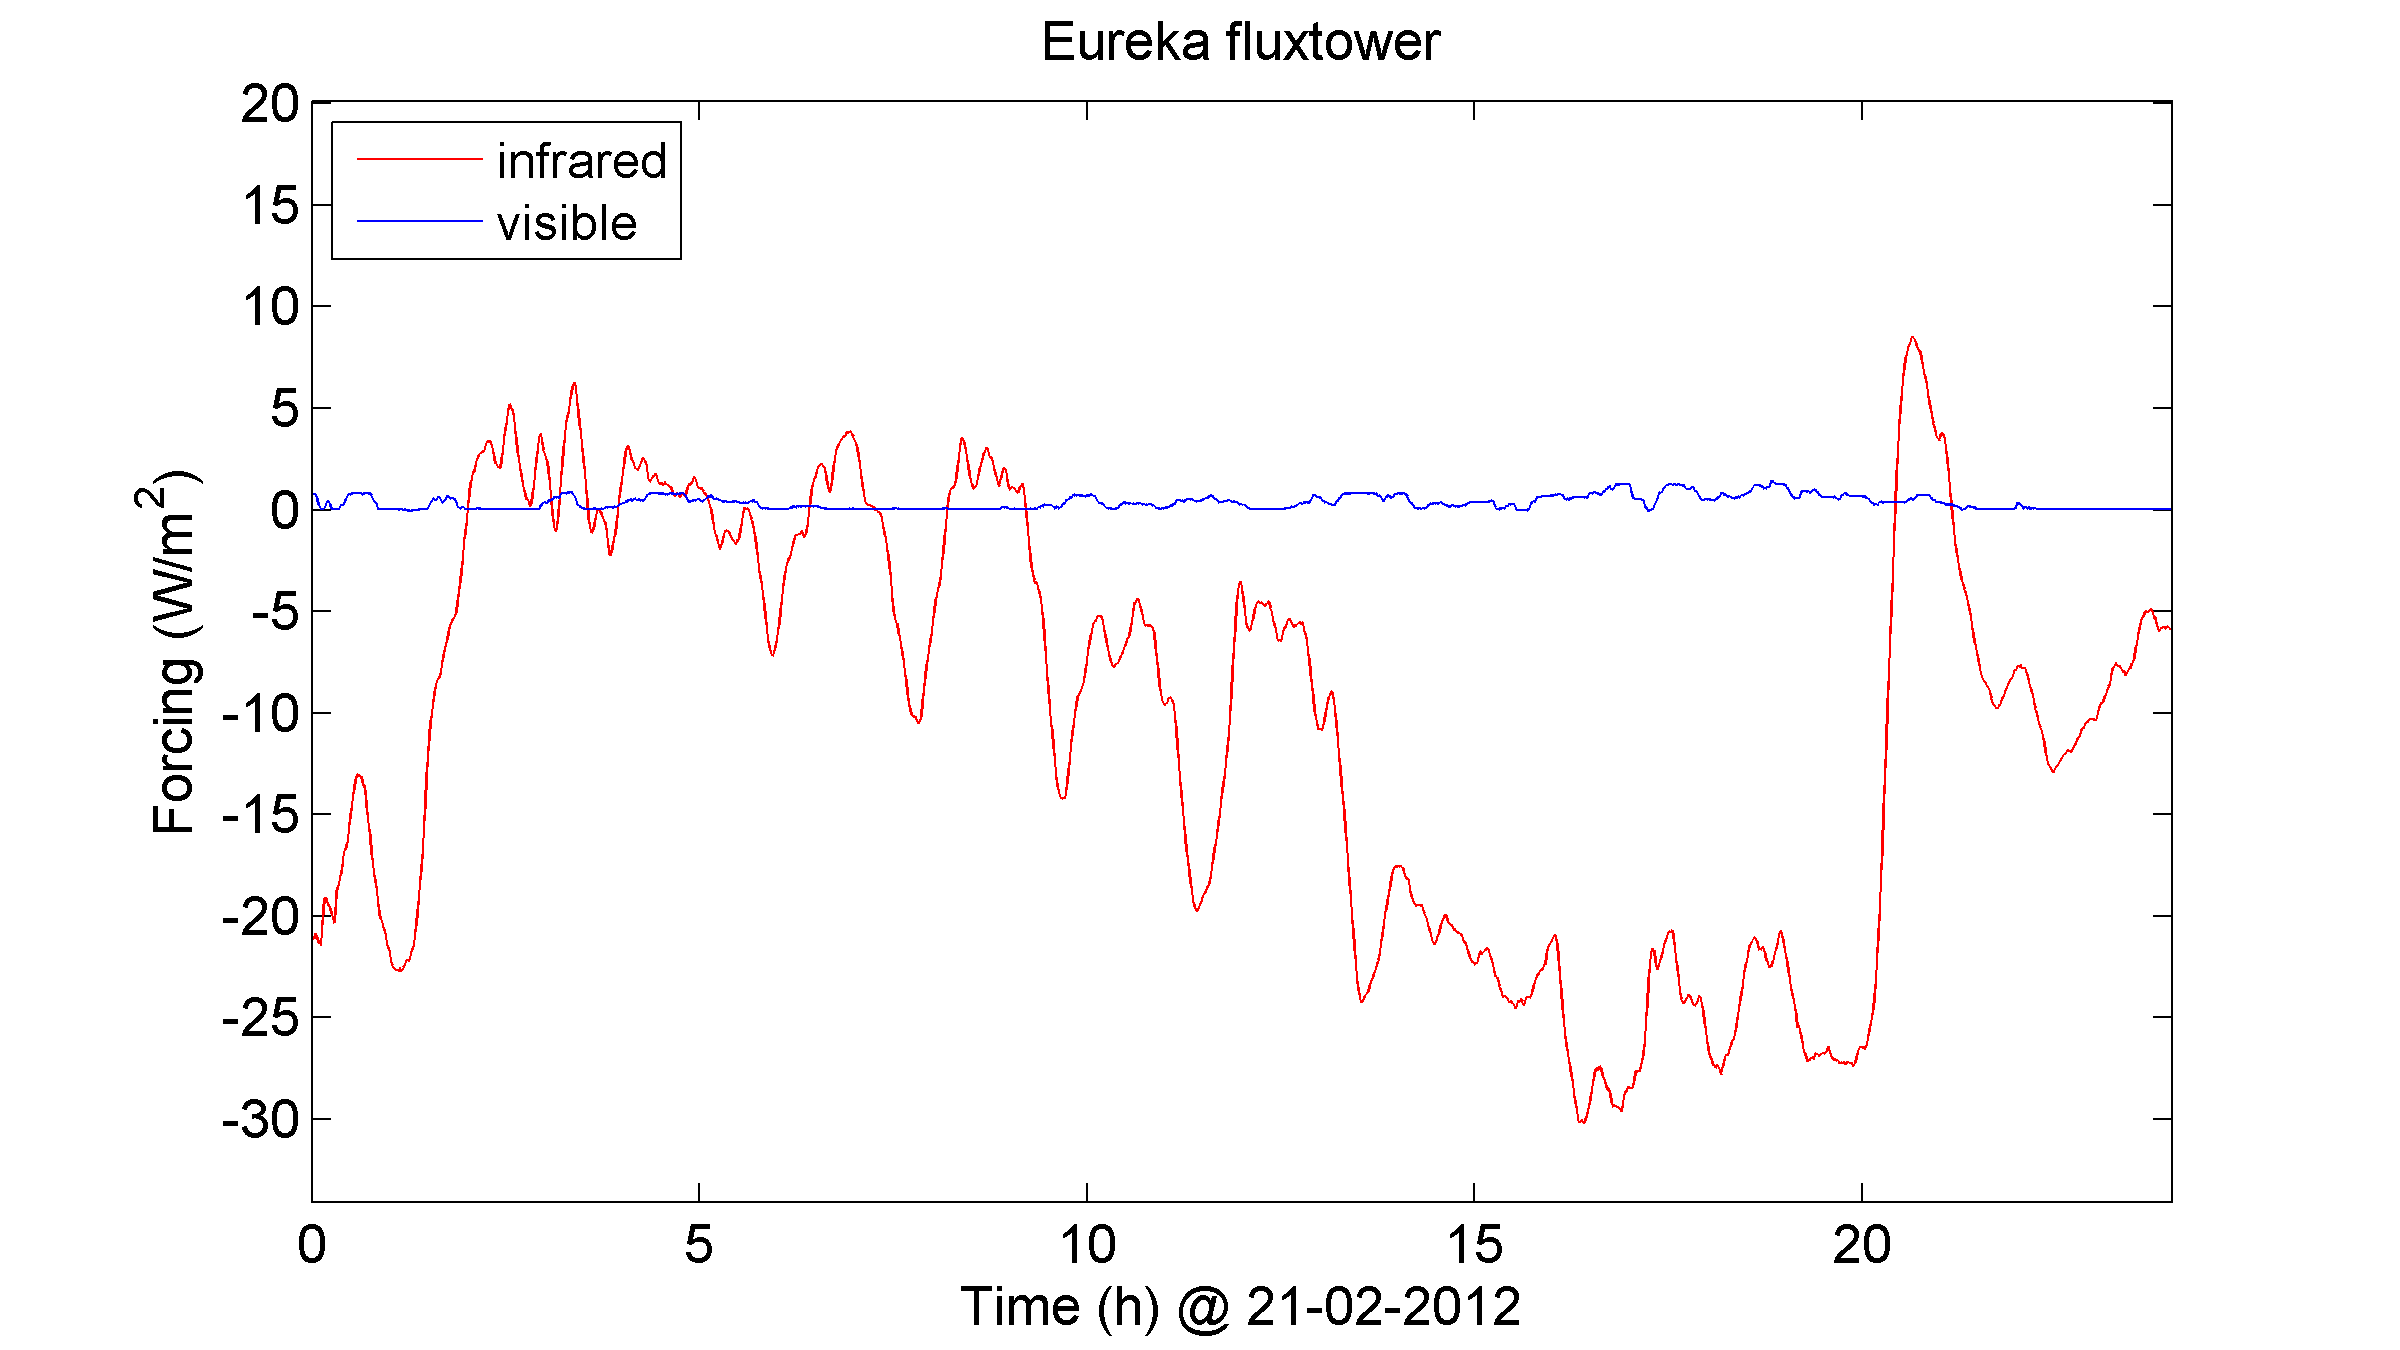
Surface temperature
Near-ground temperature at various places and elevations near Eureka. The temperature sensor 0PAL-Star is located on the external wall of the Star-Photometer Container. It gives higher temperatures than the nearby Microwave Radiometer one (0PAL-MWR) or than the Eureka Weather Station sensor (Eureka). Most probably it's affected by the temperature of the aluminum container which is warm inside and it gets even warmer when the sun is up.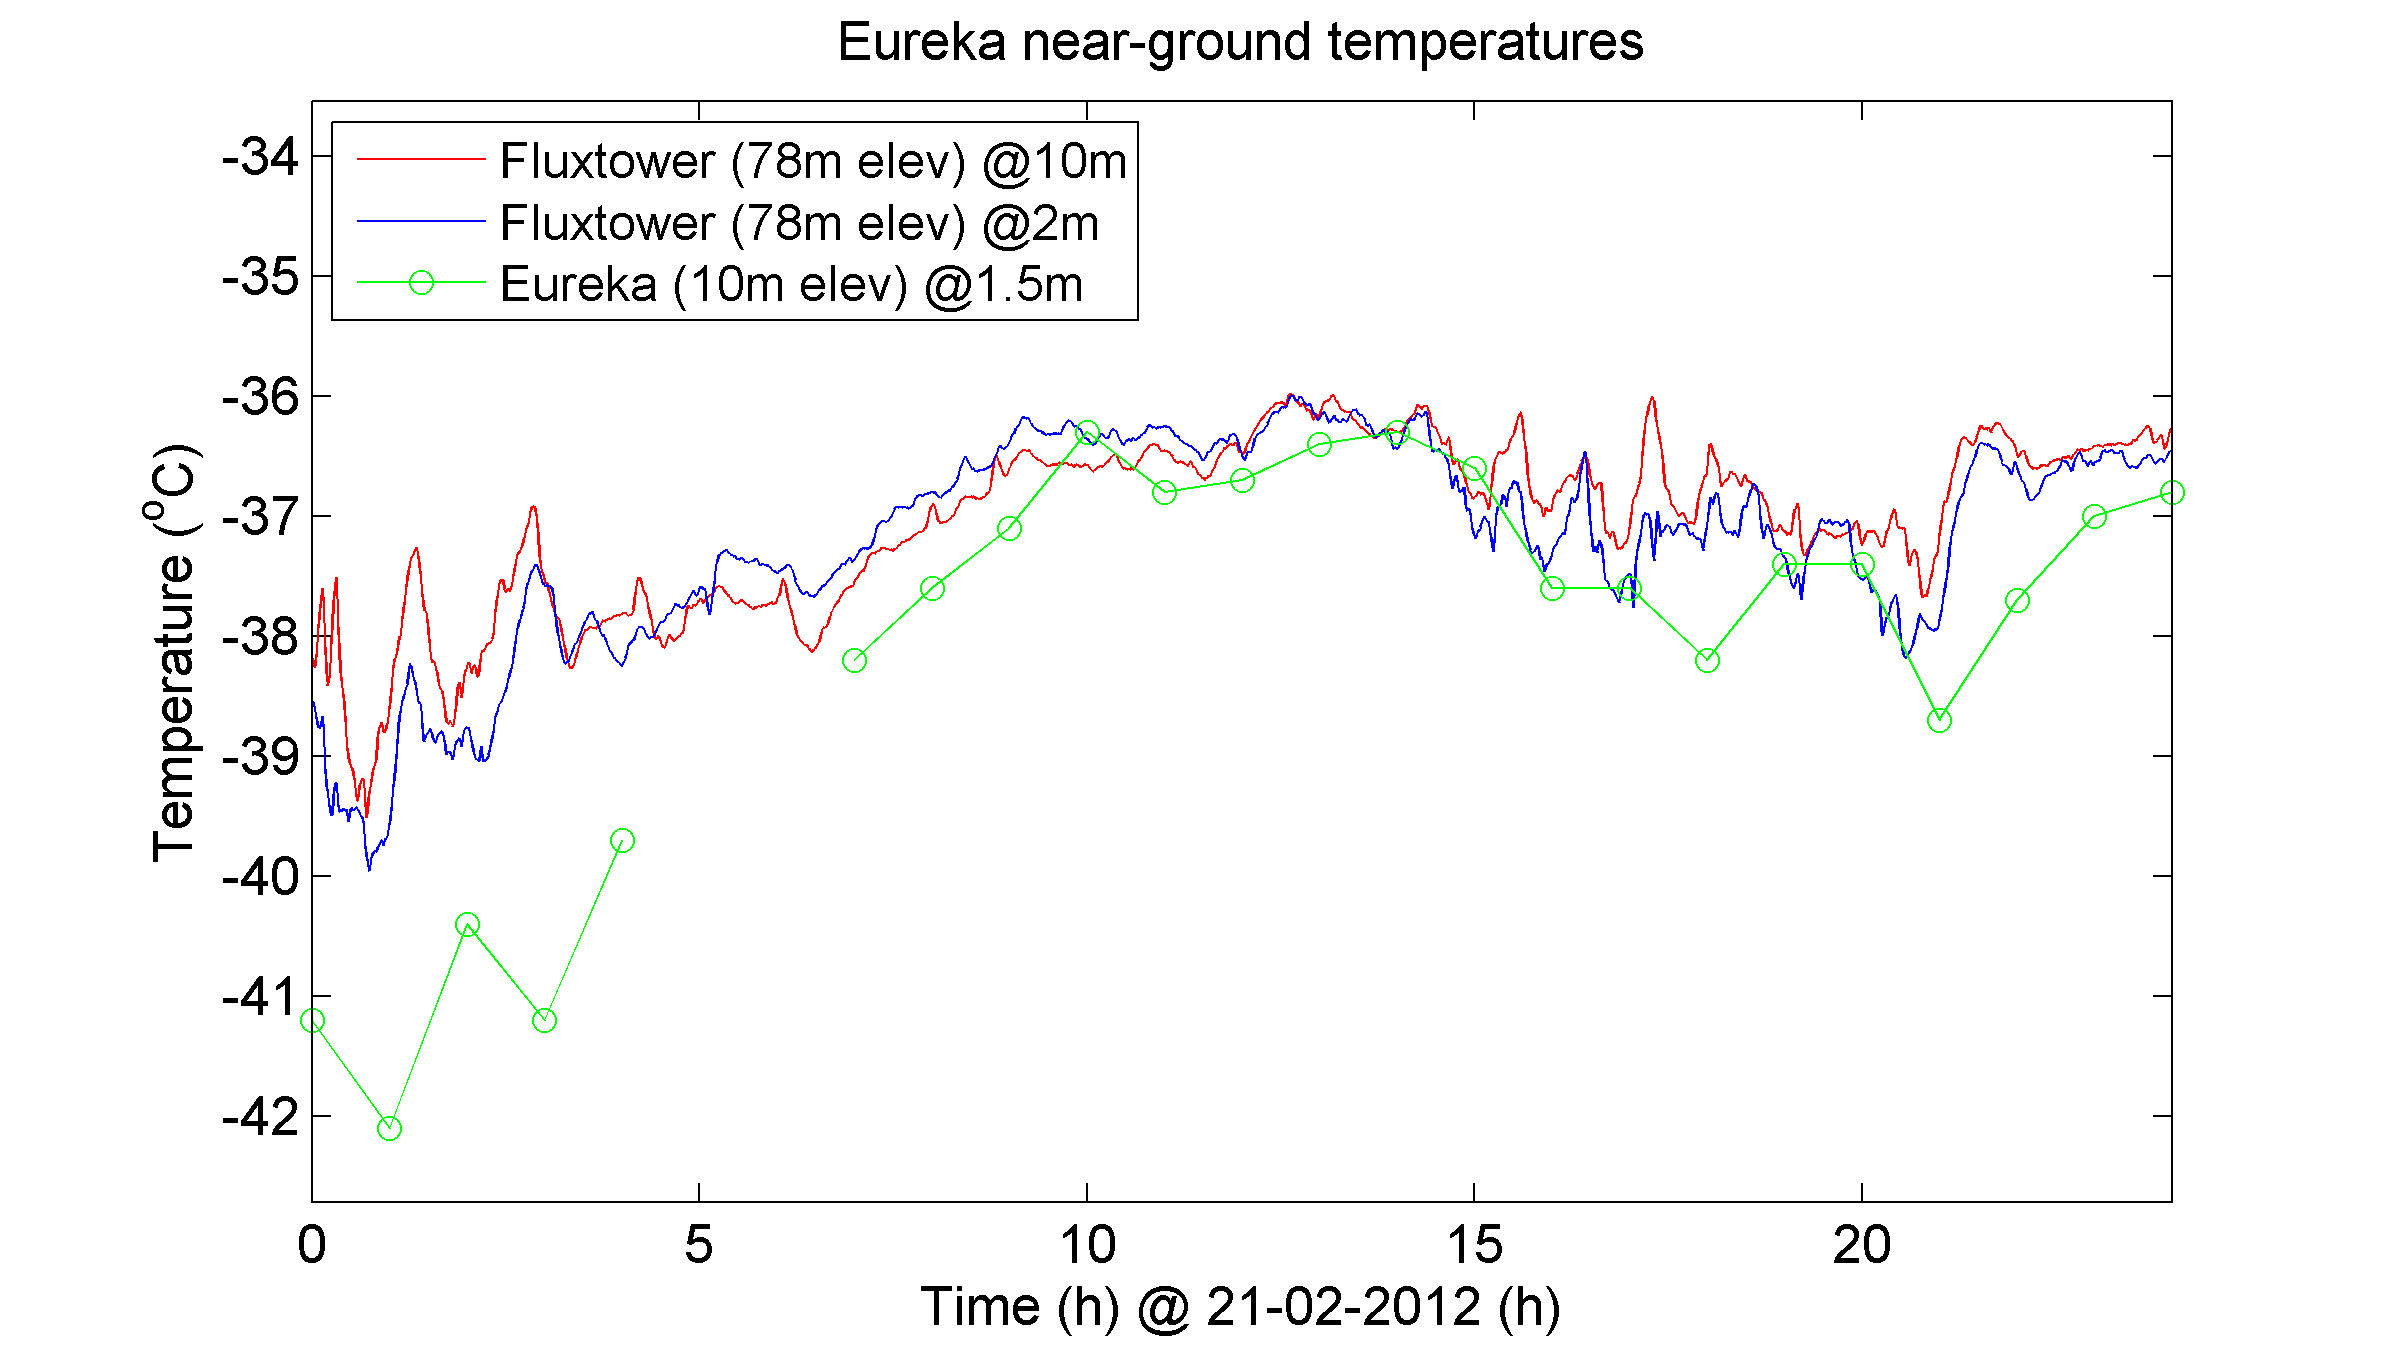
Water components along LOS
Atmospheric water components along Line of sight (LOS) retrieved from the Eureka Microwave Radiometer measurements, located at 0PAL. The recorded LOS is always towards zenith. The liquid water units are wrong in the database, and here we consider [g/m^2] instead of [cm], and then we transform to [mm].
Radiosonde scaled to fluxtower data
The following charts are obtained by scaling the pressure, temperature and water vapor pressure at 88 m elevation to the corresponding measurements at Fluxtower.